|

|
Follow us
Technology: Eye in the sky: Mapping the extent of flooded areas in Southern Queensland and Northern New South Wales using freely available Sentinel Imagery
The town of Goondiwindi, located in the Darling Downs region of Queensland and close to the New South Wales border, was surrounded by water due to a flood in the area. At the time of writing of this blog the flood waters continue to rise, causing significant loss of property and deep fears that some rural communities could cut-off for days if not weeks. During natural disasters, such as this flood event, the ability to quickly gain a real-time view of the impact is highly crucial for fast, targeted response and recovery. The challenge for us as Earth observation professionals is to provide this information in an efficient and timely manner so that the affected communities are provided with meaningful, timely assistance as well as well targeted rescue and relief effort.
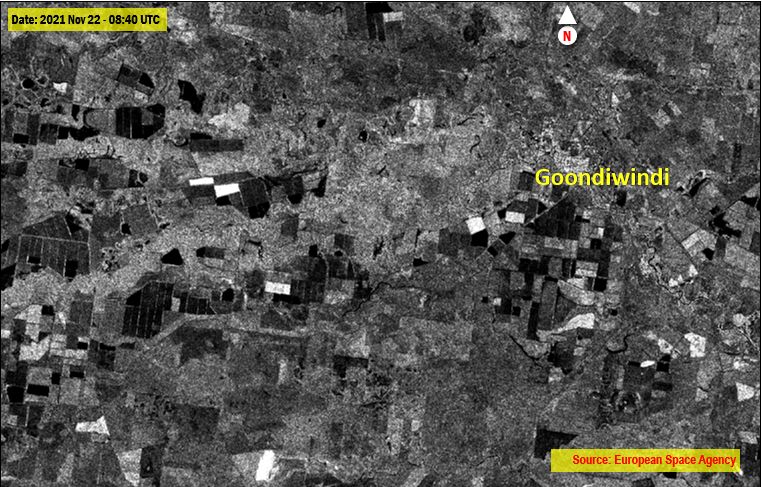
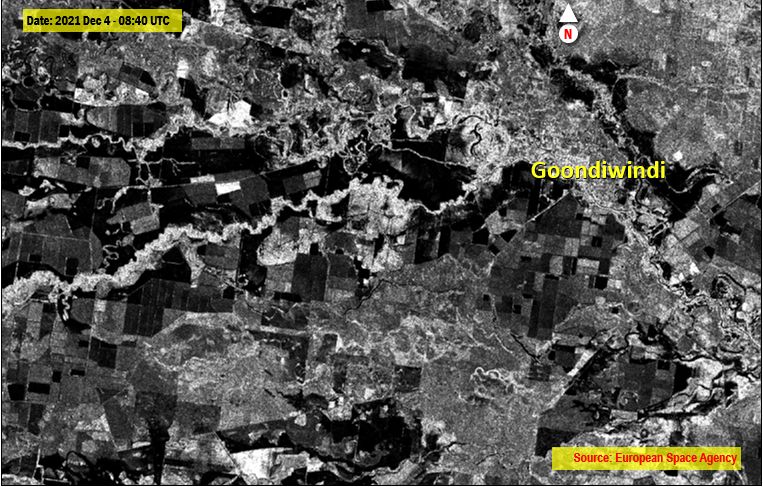
Remote sensing is inherently useful for managing natural hazards that are caused by geo-physical or climatic events, including earthquakes, volcanic eruptions, floods, droughts, storm events such as cyclones, as well as fires that threaten people’s livelihoods or property. Drones, aircrafts and satellites offer accurate, frequent and almost near-real time data over large areas anywhere in the world. When a disaster event occurs, remote sensing is often the only way to view what is happening on the ground. As remote sensing and earth observation professionals, it is our duty to provide software and services to assist in mitigation, preparedness as well as response and recovery effort to organisations and individuals directly and indirectly involved in disaster management. How can we help? The very first step in directing any relief effort is to identify areas that are affected. How quickly this can be done is based on our commitment to gather data and information over the impacted areas. As someone involved in Remote Sensing and Earth Observation, I would advocate for and immediately recommend anyone to simply to look to the skies above to get the crucial imagery needed to map the extent of the flood water. If we are good at planning, we can obtain images from commercial satellite data providers and these datasets can be put to use from day one of the flood event. Sometimes, things don’t go to plan but thankfully we have publicly available satellite imagery, thanks to the likes of ESA and USGS, which makes it possible for anyone to analyse and view areas affected by the flood. If we are lucky with the timing of satellite passing over the impacted area, then we may even get an estimate of the extent of the flood in almost near-real time. Following the devastating floods in the Southern Queensland and Northern New South Wales regions, I wanted to see first-hand the scale and extent of the damage caused. We know flooding takes place due to heavy rainfall; and during heavy rain and cloud cover it is often difficult to get optical satellite imagery such as Landsat and Sentinel. Fortunately, Synthetic Aperture Radar (SAR) imagery comes to the rescue at these times. SAR imagery can be acquired day and night and even in times of cloud and rain. I quickly scrambled to find any publicly available SAR imagery over Goondiwindi area. Unsurprisingly, the Sentinel-1 Satellite had captured a SAR image over the area on 4 December 2021, around the time when the flood was at its peak. In order to make a comparison between the time periods before and after the floods, a before image is also necessary. This is to isolate the flood affected areas using techniques of image change detection. Again, I found that there was also Sentinel-1 SAR imagery available over the exact same area in Goondiwindi acquired on 18 November 2021. Now having the minimum of two required images, I started the process of identifying areas affected by the flood. I have summarised the steps I took to identify the flood-affected areas for those who may need reference material for workflows in future:
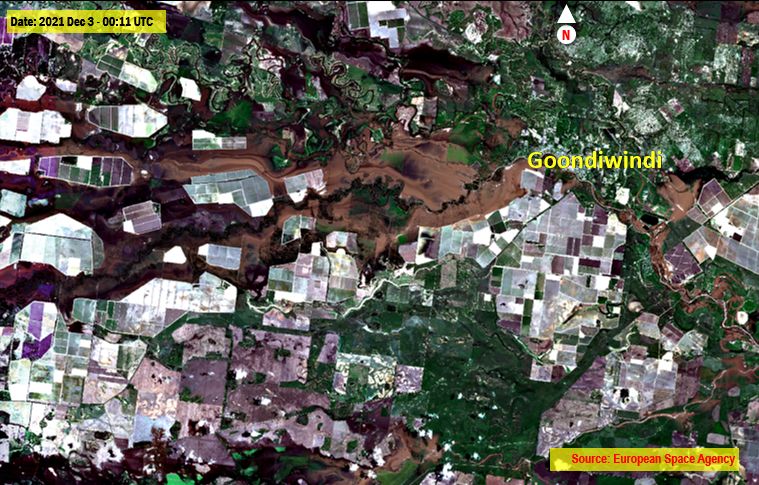
Fig 1: Pre-flood Sentinel-1 Image acquired on 22 Nov 2021 Fig 2: Sentinel-1 Image acquired on 4 Dec 2021 showing still flooding areas To provide some context to my analysis, I also downloaded freely available optical Sentinel-2 imagery also from the
Fig 3: Sentinel-2 Image acquired on 3 Dec 2021 showing still flooding areas
The flooded areas are also shown overlaid on a false colour band combination (Figure 5). In natural colour, vegetated areas are shown in green whereas in false colour composite, they are shown in red. We can clearly see vigorous vegetation growth in the area due to earlier rainfall as well. Fig 4: Flooded area (in blue) extracted using method of Image based change detection overlaid on True colour Sentinel-2 imagery Fig 5: The flooded area (in blue) was extracted using method of Image based change detection overlaid on false colour Sentinel-2 imagery. We can very clearly see the impact of the flood in the area and start to think how the information derived from this simple analysis could be useful to authorities in response and recovery efforts. In reality, the recent flood has had effects on large areas including Inglewood, Queensland amongst many other communities. It is likely the amount of water flowing through the rivers and channels is likely to cause major flooding in Northern New South Wales and other parts of Southern Queensland. The primary purpose of this article is to demonstrate the ease with which flooded areas can be extracted from publicly available imagery even through simple analysis of a few images. Identical analysis can also be extended to cover the entire areas covered by the flood. While first responders will be equipped with several other resources to get into action to combat the floods, the results provided above supply a very good macro view for authorities in head offices and senior Emergency Services officials for pre-flood and post-flood planning purposes. Although the data used for this quick analysis is free, the same technology can be utilised to create more precise commercial-grade product that provide much more detail. There is availability of several different SAR sensors, which have high revisit rates, including TerraSAR-X, COSMO-Skymed, Iceye and Capella space, to name a few. Further, more are planned to be launched in future which will further assist in the operational use of these techniques. It is also possible to utilise optical imagery from satellites such as Planet to complement the SAR based images. This is due to the fact that data from satellites such as Planet are available daily in most instances, and thus a matter of finding subsequent available cloud free imagery at the first opportunity during such flood events. From a more practical and operational standpoint, flooded areas could be overlaid with property boundaries to show exactly which properties were impacted by the floods. To operationalise such a process would be relatively straightforward – it would require a timely acquisition of higher resolution SAR imagery, near real-time processing and dissemination of the information using image analysis using ENVI and ENVI SARscape, as well as dissemination of information to end users using GIS software tools such as Esri’s ArcGIS Online. By combining Remote Sensing, publicly available free data (or commercial data if near-real time mapping is required) and GIS technology, stakeholders involved in disaster mitigation and recovery at every level (local, state or national) can create and share maps that drive accurate, timely responses. *APAC Geospatial is Exclusive distributor of ENVI and ENVI SARscape products in Australia Source: Dr Dipak Paudyal, chief scientist and managing director, APAC Geospatial |


|