
|

|

|

|

|

|
|
27 January 2023
|
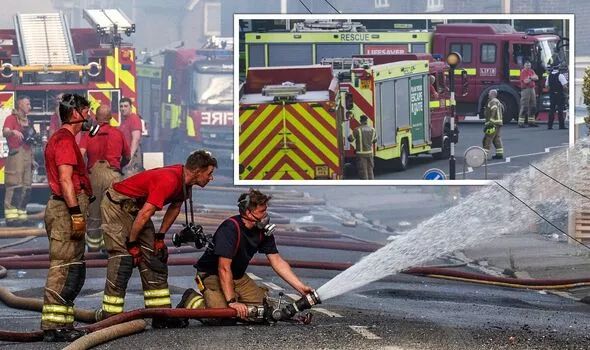
Average fire response times in England rise by 15 seconds, UK
https://www.gov.uk/government/statistics/detailed-analysis-of-response-times-to-fires-england-april-2021-to-march-2022/detailed-analysis-of-response-times-to-fires-attended-by-fire-and-rescue-services-england-april-2021-to-march-2022
Official statistics containing detailed analysis of response times to fires attended by fire and rescue services: England, April 2021 to March 2022, have revealed that fire response times have increased by 15 seconds. According to the statistics, the average response time to primary fires in the year ending March 2022 was eight minutes and 50 seconds, an increase of 15 seconds compared with the year ending March 2021. The largest component was drive time which increased by 17 seconds to five minutes 55 seconds.
All primary fire types showed an increase in average response times; dwellings by 16 seconds, other buildings by 13 seconds, road vehicles by 21 seconds and outdoor primary fires, by far the smallest category of primary fire, by nine seconds.
The average total response time to secondary fires such as smaller outdoor fires, not involving people or property, in England, decreased by 10 seconds, compared with the year ending March 2021, to nine minutes and 13 seconds.
Overall, response times to fires increased gradually between the year ending March 1995 and year ending March 2015. There was then a plateau at around eight minutes and 40 seconds from the year ending March 2015 to the year ending March 2018. Every year since response times have increased except from the year ending March 2021, where drive times decreased probably due to decreased traffic levels due to COVID-19 lockdowns.
The average total response time to primary fires in year ending March 2022 was eight minutes and 50 seconds, an increase of 47 seconds over the past decade and an increase of 12 seconds in the past five years; the pattern across different types of fire was varied.
Total response times by type of Fire and Rescue Authority (FRA)
Of the 44 fire and rescue authorities (FRAs), 39 showed an increase in average total response time to primary fires between year ending March 2021 and year ending March 2022 and five showed a decrease.
FRAs can be split into three rural-urban classifications (predominantly rural, significantly rural and predominantly urban) and by whether they are metropolitan or non-metropolitan.
Distribution of total response times
The previous chapters present (mean) average response times; however, many FRSs measure their performance based on the proportion of incidents attended within various target times. Fire statistics table FIRE1004 provides incident counts by one-minute bands (including 60 minutes) for primary and secondary fires.
Key results
In year ending March 2022:
For all fire types covered in this section (all primary fires dwelling, other building and secondary) the most frequent response time band was six to seven minutes. A greater proportion of dwelling fires were responded to within seven minutes (49 percent), relative to the other fire types, again likely due to the comparative ease of describing street addresses via telephone and the urgency with which FRSs respond to fires with increased risk to life or property. For both other building fires and all primary fires the proportion responded to within seven minutes was 41 percent. A smaller proportion of secondary fires were responded to within 7 seven minutes (36 percent) likely due to these incidents typically being less urgent and or occurring in more rural locations.
Response times and outcomes
There is no straightforward relationship between response times and the outcome of a fire. Many factors outside the control of FRSs will affect the outcome of fires including the type of fire and the time elapsed before the fire was discovered. However, assuming that slower response times may be associated with an increase in harms, this section looks at response times in relation to casualties, rescues and areas of damage.
Key results
In year ending March 2022:
Dwelling fires with casualties (including fatalities) and/or rescues have had consistently faster average response times than dwelling fires with no casualties and/or rescues. Although these comprise a relatively small number of incidents (10 percent of dwelling fires in the calculations since year ending March 2010 involved casualties and/or rescues), so are potentially more susceptible to fluctuations in average response times. The pattern is consistent across all years in the series (between nine percent and 10 percent in each year). This difference in response times to dwelling fires with casualties and/or rescues compared with those without, is generally most strongly apparent in the drive time, which was 11 seconds faster in year ending March 2022. This suggests that while dwelling fires are responded to the most quickly of all primary fire types, response times appear to reduce even further for incidents that appear to involve a risk to life, if it has been possible to collect this information from the caller.
To note, in year ending March 2022, the crew turnout time was also three seconds faster for dwelling fires with casualties and/or rescues compared with those without. This is the first year, since data became available in year ending March 2010, in which the drive time was not the only call component responsible for faster response times to dwelling fires with a risk to life.
Between year ending March 2011 and year ending March 2019 average total response times generally increased, yet the average area of damage in both dwelling and ‘other building’ fires decreased. This would seem counterintuitive as it could be assumed that increased response time would have led to increased spread due to later starting of firefighter activity. However, this assumption may have been countered by improved early detection (the proportion of households with a working smoke alarm has remained high), the gradual replacement of old furnishings with newer materials with improved fire resisting properties, new buildings with sprinkler systems and numerous other factors which are difficult to quantify.
The average area of fire damage in dwelling fires decreased by 2,5 percent over the three years between the year to March 2019 and the year to March 2022, whilst the average area of fire damage in other buildings decreased by 6,6 percent, over the same three years.
Sources: Official Statistics, Government UK
Official statistics containing detailed analysis of response times to fires attended by fire and rescue services: England, April 2021 to March 2022, have revealed that fire response times have increased by 15 seconds. According to the statistics, the average response time to primary fires in the year ending March 2022 was eight minutes and 50 seconds, an increase of 15 seconds compared with the year ending March 2021. The largest component was drive time which increased by 17 seconds to five minutes 55 seconds.
All primary fire types showed an increase in average response times; dwellings by 16 seconds, other buildings by 13 seconds, road vehicles by 21 seconds and outdoor primary fires, by far the smallest category of primary fire, by nine seconds.
The average total response time to secondary fires such as smaller outdoor fires, not involving people or property, in England, decreased by 10 seconds, compared with the year ending March 2021, to nine minutes and 13 seconds.
Overall, response times to fires increased gradually between the year ending March 1995 and year ending March 2015. There was then a plateau at around eight minutes and 40 seconds from the year ending March 2015 to the year ending March 2018. Every year since response times have increased except from the year ending March 2021, where drive times decreased probably due to decreased traffic levels due to COVID-19 lockdowns.
The average total response time to primary fires in year ending March 2022 was eight minutes and 50 seconds, an increase of 47 seconds over the past decade and an increase of 12 seconds in the past five years; the pattern across different types of fire was varied.
Total response times by type of Fire and Rescue Authority (FRA)
Of the 44 fire and rescue authorities (FRAs), 39 showed an increase in average total response time to primary fires between year ending March 2021 and year ending March 2022 and five showed a decrease.
FRAs can be split into three rural-urban classifications (predominantly rural, significantly rural and predominantly urban) and by whether they are metropolitan or non-metropolitan.
Distribution of total response times
The previous chapters present (mean) average response times; however, many FRSs measure their performance based on the proportion of incidents attended within various target times. Fire statistics table FIRE1004 provides incident counts by one-minute bands (including 60 minutes) for primary and secondary fires.
Key results
In year ending March 2022:
- The most common response time band for primary, dwelling, other building and secondary fires was six to seven minutes
- 41 percent of all primary fires were responded to within seven minutes, down two percent compared with the year ending March 2021
- 49 percent of dwelling fires were responded to within seven minutes, down three percent compared with the year ending March 2021
- 41 percent of other building fires were responded to within seven minutes, down two percent compared with the year ending March 2021
- 36 percent of secondary fires were responded to within seven minutes, up two percent compared with the year ending March 2021
For all fire types covered in this section (all primary fires dwelling, other building and secondary) the most frequent response time band was six to seven minutes. A greater proportion of dwelling fires were responded to within seven minutes (49 percent), relative to the other fire types, again likely due to the comparative ease of describing street addresses via telephone and the urgency with which FRSs respond to fires with increased risk to life or property. For both other building fires and all primary fires the proportion responded to within seven minutes was 41 percent. A smaller proportion of secondary fires were responded to within 7 seven minutes (36 percent) likely due to these incidents typically being less urgent and or occurring in more rural locations.
Response times and outcomes
There is no straightforward relationship between response times and the outcome of a fire. Many factors outside the control of FRSs will affect the outcome of fires including the type of fire and the time elapsed before the fire was discovered. However, assuming that slower response times may be associated with an increase in harms, this section looks at response times in relation to casualties, rescues and areas of damage.
Key results
In year ending March 2022:
- The average total response time to dwelling fires involving casualties and/or rescues in England was seven minutes 39 seconds; this was an eight second increase compared with year ending March 2021 and an increase of 47 seconds since year ending March 2010.
- The average total response time to dwelling fires without casualties and/or rescues was seven minutes 53 seconds; this was a 16 second increase compared with year ending 2021 and an increase of 39 seconds since year ending March 2010
- The average area of fire damage to dwellings, excluding those incidents with areas of damage over 5 000m2, in England decreased from 14,8m2 in year ending 2021 to 14,2m2; at the same time the average response time to dwelling fires increased by 16 seconds.
Dwelling fires with casualties (including fatalities) and/or rescues have had consistently faster average response times than dwelling fires with no casualties and/or rescues. Although these comprise a relatively small number of incidents (10 percent of dwelling fires in the calculations since year ending March 2010 involved casualties and/or rescues), so are potentially more susceptible to fluctuations in average response times. The pattern is consistent across all years in the series (between nine percent and 10 percent in each year). This difference in response times to dwelling fires with casualties and/or rescues compared with those without, is generally most strongly apparent in the drive time, which was 11 seconds faster in year ending March 2022. This suggests that while dwelling fires are responded to the most quickly of all primary fire types, response times appear to reduce even further for incidents that appear to involve a risk to life, if it has been possible to collect this information from the caller.
To note, in year ending March 2022, the crew turnout time was also three seconds faster for dwelling fires with casualties and/or rescues compared with those without. This is the first year, since data became available in year ending March 2010, in which the drive time was not the only call component responsible for faster response times to dwelling fires with a risk to life.
Between year ending March 2011 and year ending March 2019 average total response times generally increased, yet the average area of damage in both dwelling and ‘other building’ fires decreased. This would seem counterintuitive as it could be assumed that increased response time would have led to increased spread due to later starting of firefighter activity. However, this assumption may have been countered by improved early detection (the proportion of households with a working smoke alarm has remained high), the gradual replacement of old furnishings with newer materials with improved fire resisting properties, new buildings with sprinkler systems and numerous other factors which are difficult to quantify.
The average area of fire damage in dwelling fires decreased by 2,5 percent over the three years between the year to March 2019 and the year to March 2022, whilst the average area of fire damage in other buildings decreased by 6,6 percent, over the same three years.
Sources: Official Statistics, Government UK